Iris Species Classification with Conditional GMM
This example shows how to use conditional GMMs to model the relationship between flower measurements and species.
What you'll see:
Conditional density plots for each iris species
Data points overlaid on the density contours
Comparison of different GMM approaches
Dataset: 150 samples, 2 features
Species: ['setosa' 'versicolor' 'virginica']
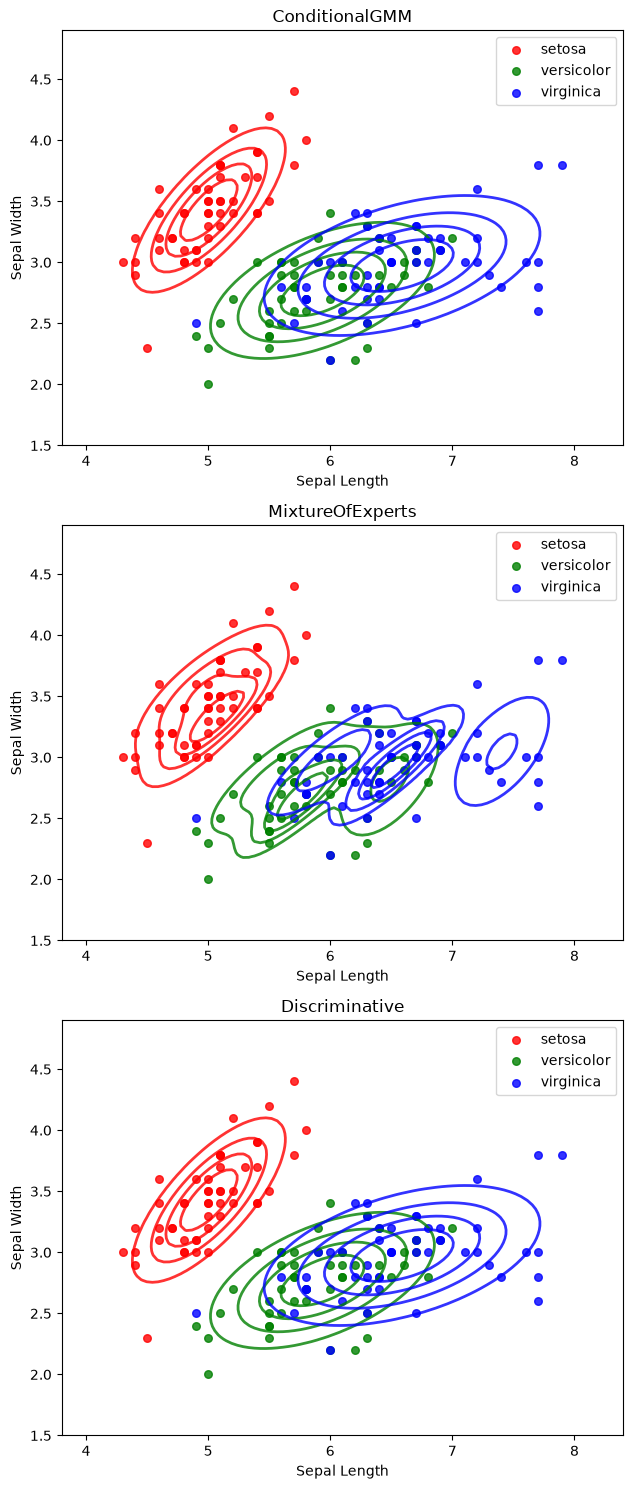
Model Performance:
========================================
ConditionalGMM : Log-likelihood = -0.785
MixtureOfExperts: Log-likelihood = -0.719
Discriminative : Log-likelihood = -0.785
Gallery Image
# Gallery image
fig, ax = plt.subplots(1, 1, figsize=(8,6))
colors = ['red', 'green', 'blue']
name = 'Discriminative'
model = DiscriminativeConditionalGMMRegressor(n_components=3, random_state=42)
model.fit(y_onehot, X)
# Create grid for density evaluation
x_min, x_max = X[:, 0].min() - 0.5, X[:, 0].max() + 0.5
y_min, y_max = X[:, 1].min() - 0.5, X[:, 1].max() + 0.5
xx, yy = np.meshgrid(np.linspace(x_min, x_max, 100), np.linspace(y_min, y_max, 100))
grid_points = np.column_stack([xx.ravel(), yy.ravel()])
# Plot conditional densities for each species
for species_idx in range(3):
# Create batch of species labels for all grid points
species_onehot_batch = np.zeros((grid_points.shape[0], 3))
species_onehot_batch[:, species_idx] = 1.0
# Calculate density for all grid points at once using log_prob
log_density = model.log_prob(species_onehot_batch, grid_points)
density = np.exp(log_density)
density = density.reshape(xx.shape)
# Normalize density for better visualization
density = density / density.max()
# Plot contour with same color as data points
ax.contour(xx, yy, density, levels=5, alpha=0.8, colors=[colors[species_idx]], linewidths=2)
# Plot data points for this species
species_mask = y_labels == species_idx
ax.scatter(X[species_mask, 0], X[species_mask, 1],
c=colors[species_idx], s=30, alpha=0.8,
label=species_names[species_idx])
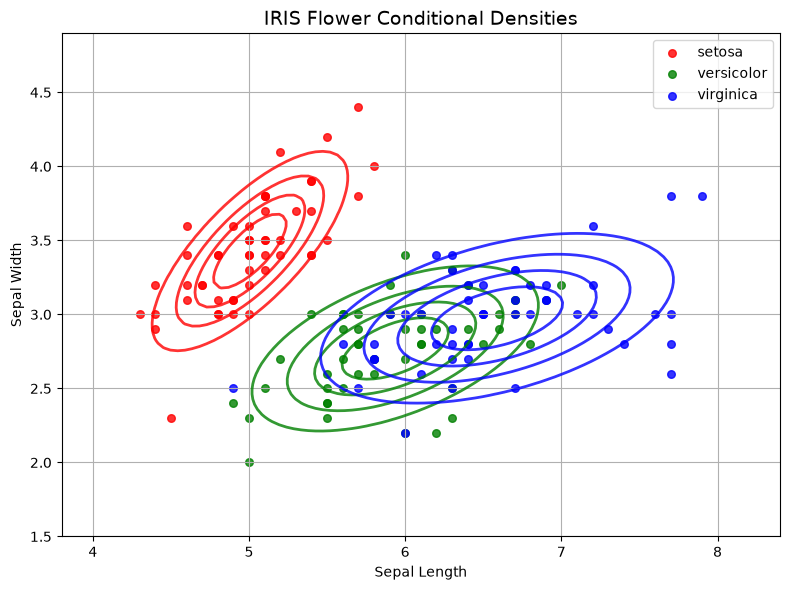
ax.set_xlabel('Sepal Length')
ax.set_ylabel('Sepal Width')
ax.set_title('IRIS Flower Conditional Densities', fontsize=14)
ax.legend()
ax.grid()
plt.tight_layout()
plt.savefig('gallery_images/iris.png', dpi=150, bbox_inches='tight')
plt.show()