Digits Conditional Modeling Study
This notebook studies how different conditional regression models learn to generate digit images conditioned on their labels.
Problem Setup:
Targets: 8 PCA components of 64-pixel digit images
Conditioning: 10-dimensional one-hot encoded digit labels (0-9)
Goal: Learn p(pixels | digit_label) - generate realistic digit images given the label
Models Compared:
ConditionalGMMRegressor: Joint GMM over [X, y] with analytical conditioning
MixtureOfExpertsRegressor: Linear-softmax gating with Gaussian experts
DiscriminativeConditionalGMMRegressor: Discriminative EM for conditional likelihood
Visualization: For each model, we'll show a 9×5 grid where:
Rows represent digits 0-9
Columns show 5 random samples generated for each digit
This allows us to assess the quality and diversity of generated digits
Data Preparation
Load the digits dataset and prepare it for conditional modeling:
Dataset shape: (1797, 64)
Labels: [0 1 2 3 4 5 6 7 8 9]
Label distribution: [178 182 177 183 181 182 181 179 174 180]

PCA Results:
  Explained variance ratio: 0.793
  PCA components shape: (1797, 20)
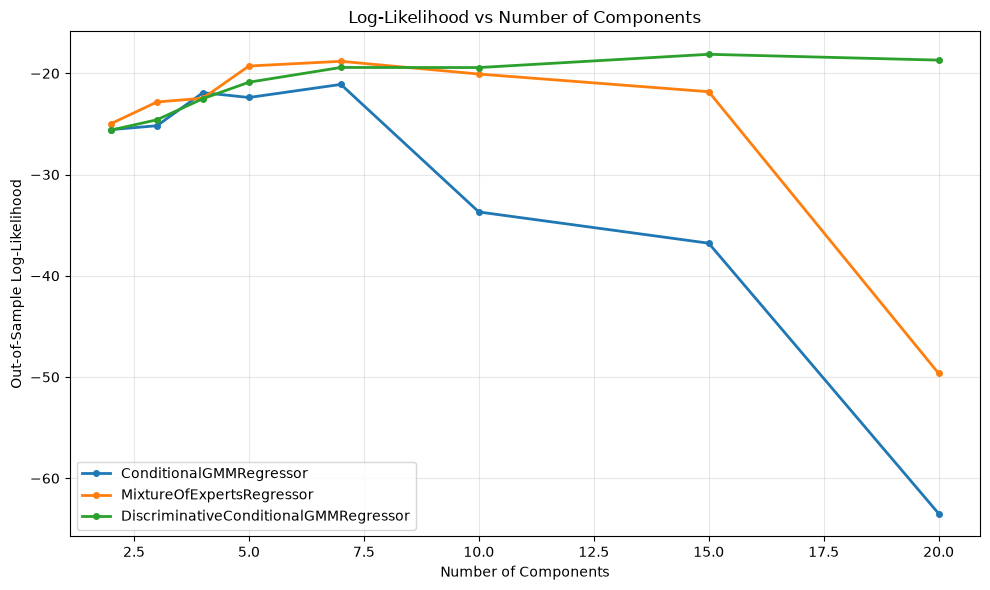
Hyperparameter Optimization
Perform out-of-sample hyperparameter search by sweeping over n_components = 2..20 for all three models:
Optimal Hyperparameters (Out-of-Sample Performance):
======================================================================
ConditionalGMMRegressor:
  Optimal n_components: 7
  Best log-likelihood: -21.097
  Best MSE: 1.302
  Best R²: 0.247

MixtureOfExpertsRegressor:
  Optimal n_components: 7
  Best log-likelihood: -18.816
  Best MSE: 1.833
  Best R²: -0.053

DiscriminativeConditionalGMMRegressor:
  Optimal n_components: 15
  Best log-likelihood: -18.123
  Best MSE: 1.316
  Best R²: 0.227

======================================================================
<Figure size 640x480 with 0 Axes>
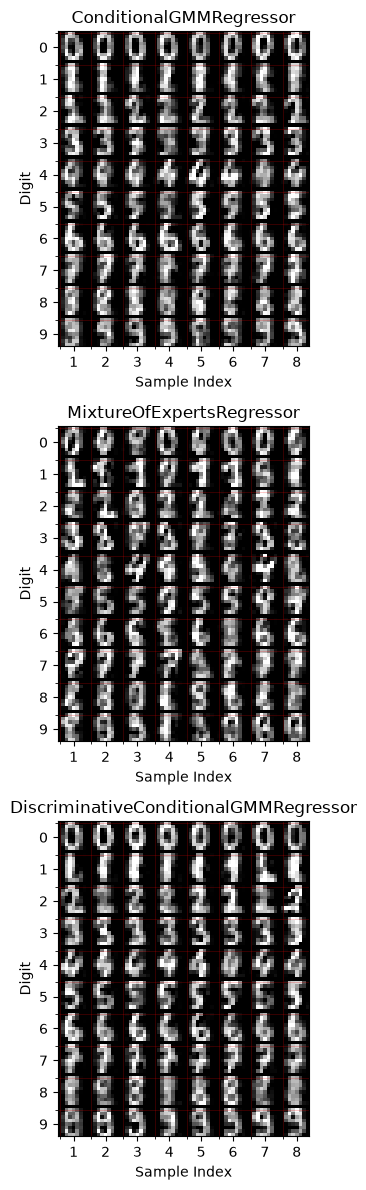
Digit Generation and Visualization
Generate random samples for each digit (0-9) using each model and visualize them in a 10×5 grid:
Generating 8 samples for each digit (0-9) using best models...
  ConditionalGMMRegressor: n_components = 7
  MixtureOfExpertsRegressor: n_components = 7
  DiscriminativeConditionalGMMRegressor: n_components = 15
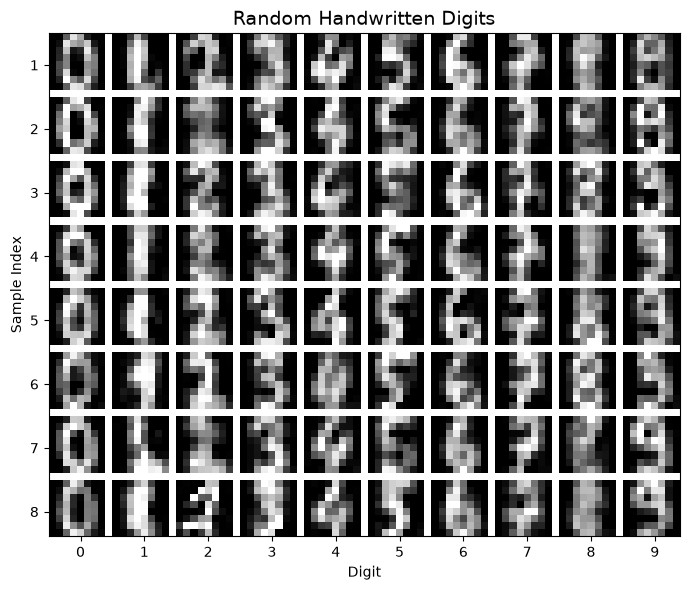
Gallery Image
fig, ax = plt.subplots(1, 1, figsize=(12, 6))

model_name = 'DiscriminativeConditionalGMMRegressor'

# Create a 8x10 grid with 1 pixel spacing between 8x8 images (transposed)
# Grid size: 8 rows * (8 pixels + 1 spacing) - 1, 10 cols * (8 pixels + 1 spacing) - 1
grid = np.zeros((n_samples_per_digit * 9 - 1, 10 * 9 - 1))  # 71x89 pixels

# Fill grid with white background (16 is max pixel value, so 16 = white)
grid.fill(16)

for digit in range(10):
    if digit in generated_samples[model_name]:
        samples = generated_samples[model_name][digit]
        for sample_idx in range(min(n_samples_per_digit, len(samples))):
            # Reshape to 8x8 image
            image = samples[sample_idx].reshape(8, 8)

            # Place in grid with 1 pixel spacing (transposed)
            row_start = sample_idx * 9  # 8 pixels + 1 spacing
            col_start = digit * 9  # 8 pixels + 1 spacing
            grid[row_start:row_start+8, col_start:col_start+8] = image

# Display the grid
im = ax.imshow(grid, cmap='gray', vmin=0, vmax=16)
ax.set_title('Random Handwritten Digits', fontsize=14)
ax.set_xlabel('Digit')
ax.set_ylabel('Sample Index')

# Set ticks (adjusted for 1 pixel spacing)
ax.set_xticks(range(4, 10*9, 9))  # Center of each 8x8 image with spacing
ax.set_xticklabels(range(10))
ax.set_yticks(range(4, n_samples_per_digit*9, 9))  # Center of each 8x8 image with spacing
ax.set_yticklabels(range(1, n_samples_per_digit + 1))

# No grid lines needed - white padding already provides separation

plt.tight_layout()
plt.savefig('gallery_images/digits.png', dpi=150, bbox_inches='tight')

plt.show()