Amsterdam Weather Analysis - KNMI Data
Analysis of 10 years of hourly weather data from KNMI (Royal Netherlands Meteorological Institute). Data is in UTC with proper timezone handling.
Features:
Temperature (°C) at 1.50m height
Wind speed (m/s) 10-minute average
Global horizontal irradiance (W/m²) hourly
Analysis:
Hourly model with daily/annual cycles
Daily model with annual cycles
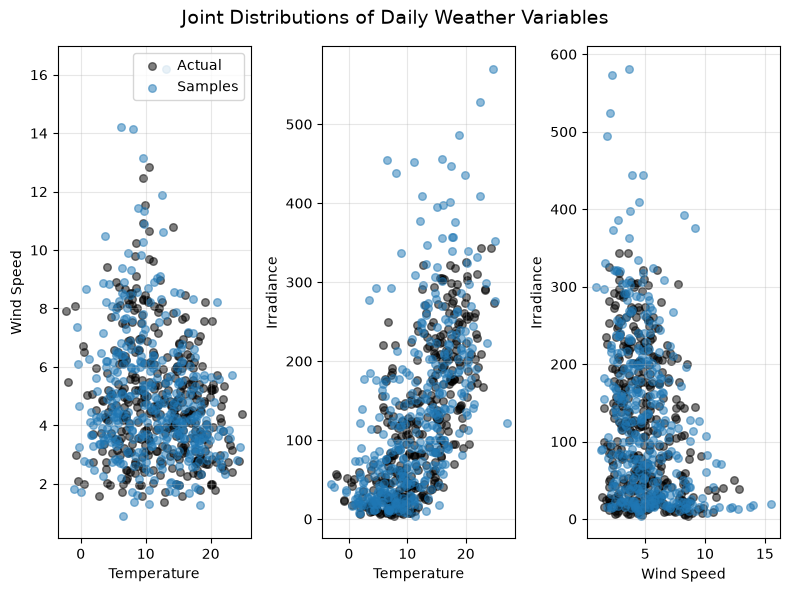
Pairwise joint distributions
Load and Prepare Data
Data: 96,432 records from 2014-01-01 00:00:00 to 2024-12-31 23:00:00
Columns: ['temp_c', 'wind_ms', 'ghi_wm2', 'wind_ms_log1p', 'ghi_wm2_log1p'] (wind_ms and ghi_wm2 log1p transformed)
| temp_c | wind_ms | ghi_wm2 | wind_ms_log1p | ghi_wm2_log1p | |
|---|---|---|---|---|---|
| datetime | |||||
| 2014-01-01 00:00:00 | 6.2 | 7.0 | 0.0 | 2.079442 | 0.0 |
| 2014-01-01 01:00:00 | 5.6 | 6.0 | 0.0 | 1.945910 | 0.0 |
| 2014-01-01 02:00:00 | 6.2 | 6.0 | 0.0 | 1.945910 | 0.0 |
| 2014-01-01 03:00:00 | 5.2 | 6.0 | 0.0 | 1.945910 | 0.0 |
| 2014-01-01 04:00:00 | 4.9 | 6.0 | 0.0 | 1.945910 | 0.0 |
Hourly Model with Daily/Annual Cycles
Features: 4, Targets: 3
Hourly model fitted: 5 components
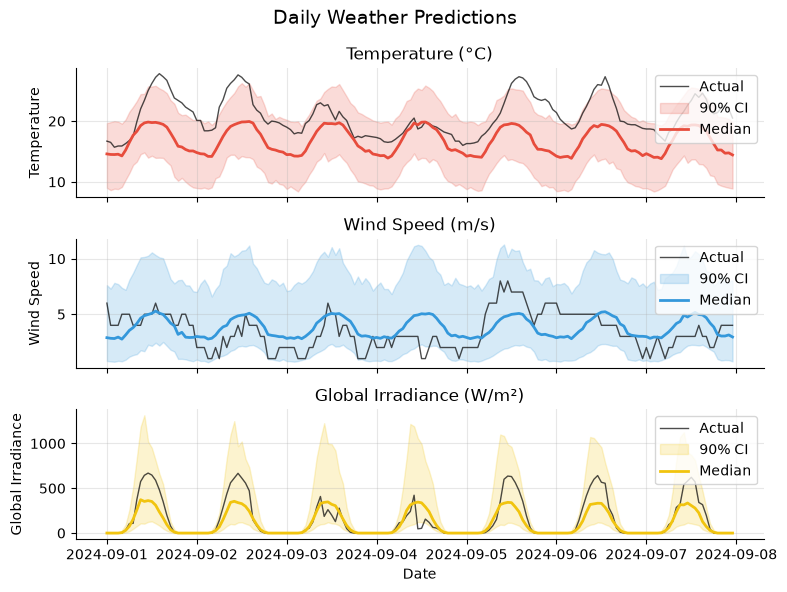
Hourly Predictions and Plots (2023-2024)
Generated 1000 samples for 168 time points (Sep 1-7, 2024)
Daily Model with Annual Cycles
Daily data: 4018 days from 2014-01-01 00:00:00 to 2024-12-31 00:00:00
Daily model fitted: 8 components
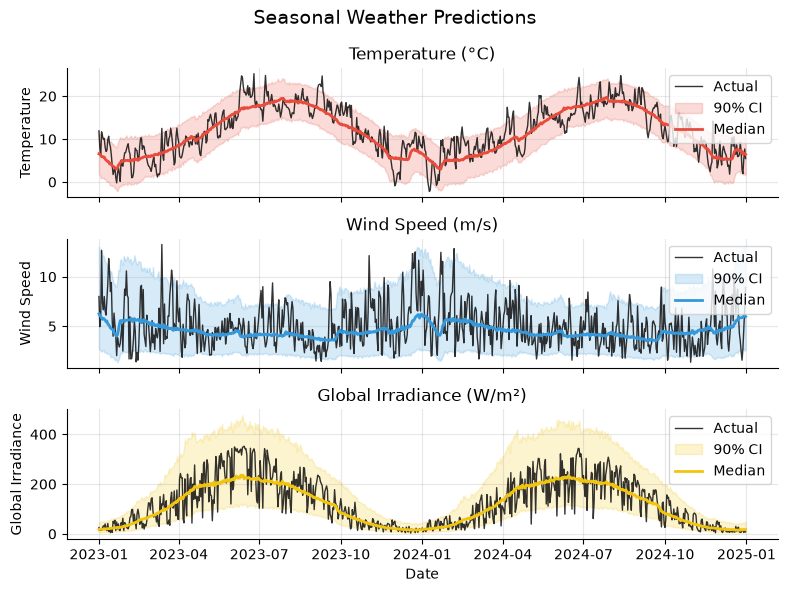
Daily Predictions and Plots (2023-2024)
Daily samples: 1000 samples for 731 days
Daily Pairwise Distributions (2024)
2024 daily data: 366 days, 366000 samples